

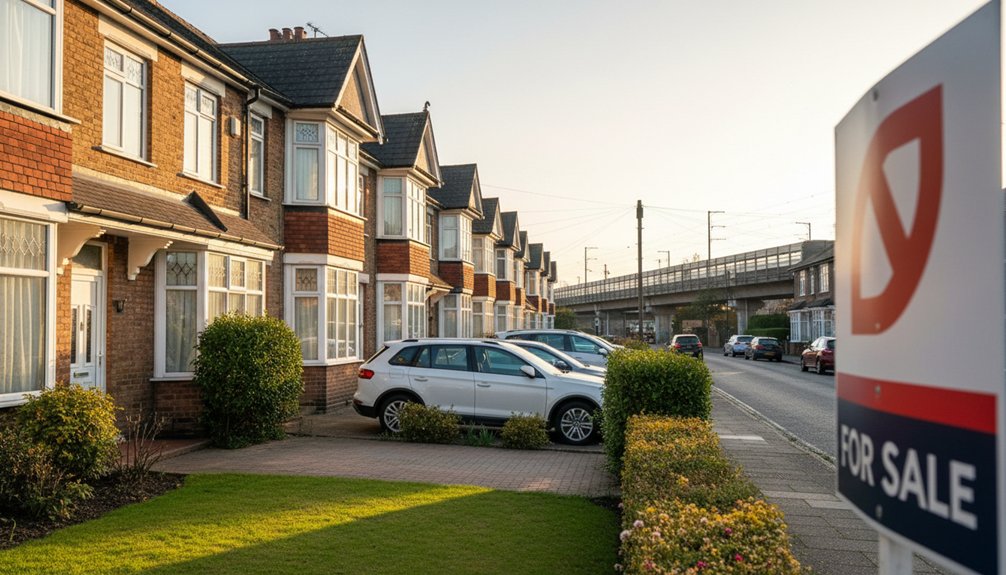
You’ll understand Harrow house prices best by anchoring to recent sold comparables and £/sq ft, not headline averages that skew high in mixed stock. In 2026, borrowing costs and rising listings soften competition, widen discounts, and lengthen negotiation windows in weaker micro-markets (higher-density flats, short leases, high service charges). Prices stay firmer near Underground stations and strong school catchments, where family homes and scarce stock hold value. Keep going to see which areas, property types, and checks matter most.
Key Takeaways
- Harrow house prices sit between Brent and Ealing, with transport links and housing type driving major local pricing differences.
- Median prices best reflect “typical” sales, while mean prices can be skewed by larger, premium properties and mixed stock.
- Rising listings versus completions is widening discounts and reducing competition, especially away from key station catchments.
- Pinner, North Harrow, and Harrow-on-the-Hill outperform, while Wealdstone and Roxeth often lag due to density and buyer softness.
- Borrowing costs, EPC retrofit requirements, and new-build oversupply risks will be key drivers of price movement through 2026.
Harrow House Prices Now: Average, Median, Range
While Harrow’s housing market varies by postcode, property type, and condition, recent sales data typically summarises it using three core metrics: the average (mean) price, the median price, and the observed price range.
You use the mean to benchmark overall pricing, but you treat it cautiously because high-value sales can skew it.
You rely on the median to represent the “typical” transaction, especially in mixed stock.
You interpret the range as a spread between lower-condition or smaller homes and larger, better-located properties, and you check sample size and time window.
To contextualise today’s figures, you compare them with Historical pricing by property type and tenure.
You also quantify renovation impact by contrasting like-for-like condition-adjusted sales and uplift from post-refurbishment resales.
Are Harrow House Prices Up or Down This Year?
To judge whether Harrow house prices are up or down this year, you’ll track year-to-date changes across sold prices, asking prices, and indices, and compare them with the same period last year.
You’ll then test whether the movement reflects composition effects (mix of property types), shifts in transaction volume, or genuine price inflation/deflation.
Finally, you’ll link the trend to measurable drivers such as mortgage rates, local supply, time-on-market, and buyer demand indicators.
Year-to-Date Price Trends
Although month-to-month figures can swing on small sample sizes, the year-to-date (YTD) trend gives you the clearest read on whether Harrow house prices are broadly rising or falling in the current calendar year.
To assess direction, you should compare the latest average sold-price index to the value recorded in January, then express the difference as a percentage. If YTD is positive, prices have risen overall; if negative, they’ve softened despite any short-term rebounds.
You’ll also want to segment by property type, because flats and houses often diverge, and mix-adjusted indices can shift as transaction composition changes.
Anchor your view in Historical trends to separate noise from signal, and treat market predictions as conditional on updated YTD readings.
Factors Driving Price Shifts
Year-to-date movement tells you the direction of Harrow house prices, but it doesn’t explain the causes behind that shift. You’ll typically see pricing respond to changes in mortgage rates, buyer affordability, and the supply of new listings.
When rates rise, you often face weaker demand and longer time on market; when rates stabilise, price cuts can narrow.
You should also track micro-location effects. Homes near stronger local amenities—schools, transit links, parks, and retail—tend to hold value better under stress.
Stock characteristics matter too: period homes with historic architecture can attract scarcity premiums, but you may discount for retrofit costs and EPC constraints.
If sellers anchor to peak-era comparables, you’ll see more renegotiations and higher fall-through rates.
What’s Pushing Harrow Prices Up (or Down) in 2026

As 2026 unfolds, Harrow’s house prices respond less to headlines and more to measurable shifts in borrowing costs, local supply, and buyer demand. You’ll see market fluctuations track transaction volumes, time-on-market, and the gap between asking and achieved prices.
When listings rise faster than completions, competition softens and discounts widen; when stock tightens, agreed prices firm even without higher bids.
You can also trace economic influences through employment stability, household formation, and migration into well-connected neighbourhoods near rail links. If new-build delivery lags planning approvals, chains break and upward pressure concentrates in family homes.
Conversely, higher running costs and EPC expectations reprice older stock, shifting demand toward efficient properties. You should watch price per square foot and mix-adjusted indices to separate true moves from changing sales composition.
Mortgage Rates and Affordability in Harrow (What Changes)
Borrowing costs sit at the centre of Harrow’s price changes because they set the ceiling for what you can bid without stretching affordability. When rates rise, lenders’ stress tests typically assume higher reversionary payments, so your maximum loan size falls even if your income hasn’t changed.
That shifts the binding constraint from deposit to monthly payment, tightening affordability challenges for leveraged buyers.
If rates stabilise or edge down, you’ll usually regain borrowing capacity and can refinance sooner from a fixed deal, lowering effective monthly outgoings.
Your mortgage options matter: longer fixes reduce payment volatility but can price in term premia; shorter fixes track market moves but raise reset risk.
For you, the key metric is the payment-to-income ratio after fees and insurance cover.
Demand in Harrow: Viewings, Offers, Time to Sell
To gauge demand in Harrow, you track viewing volumes over time and compare them with recent listing levels to quantify buyer engagement.
You then assess offer activity—offers per listing, bid-to-ask ratios, and the share of homes achieving multiple offers—to estimate competition.
Finally, you measure average time to sell from listing to agreed sale, since shorter marketing periods typically indicate stronger demand holding other factors constant.
Viewing Levels And Trends
While headline prices show where sellers want the market to go, viewing volumes, offer rates, and time-to-sell show where demand actually sits in Harrow. You’ll see demand firm when listings sustain weekly viewings above local baselines and when enquiries don’t drop after the first 10–14 days online.
Track viewing trends by property type, price band, and micro-area, because aggregated numbers can mask split-speed markets. Compare current viewing counts against Historical pricing cycles: if viewings rise while achieved prices lag, demand improves but buyers stay value-led. If viewings fall while prices hold, sellers may resist adjustment and listings can stagnate.
Use this alongside Market predictions: mortgage-rate changes and stock levels typically lead viewing shifts by 4–8 weeks in Harrow’s data.
Offer Activity And Competition
Because viewings only signal intent, offer activity and competition show whether Harrow buyers will commit at a given price point. You can track commitment by comparing offers per listing, the share of homes receiving multiple bids, and the gap between asking and agreed prices.
When buyer confidence strengthens, you’ll typically see more first-time offers arriving within days, fewer conditional bids, and tighter price negotiations. During market fluctuations, competition often polarises: correctly priced, well-presented homes attract rival bids, while optimistic listings see reduced offer volume and wider discount requests.
You should also watch fall-through risk signals, such as low deposits, extended chains, or finance contingencies, because they dilute headline demand even when viewings remain high.
Average Time To Sell
Even if viewing volumes look healthy, average time to sell shows how quickly Harrow demand converts into an agreed deal at today’s pricing. You should track the median days from listing to “Sold STC,” split by price band and property type, because outliers can distort averages.
If days-on-market shortens while agreed prices hold, you’re seeing strong market psychology: buyers accept current valuations and act decisively. If it lengthens despite plenty of viewings, you’re likely facing pricing friction, mortgage constraint, or over-supply in that segment.
You can test this by comparing time to first offer versus time from offer to acceptance. For sellers, tighter timelines usually reward accurate initial pricing over later reductions. For buyers, longer timelines can widen negotiation windows and inform investment strategies on entry price and refurbishment risk.
Harrow vs Nearby Boroughs: Brent, Ealing, Hillingdon
If you’re weighing Harrow against neighbouring boroughs such as Brent, Ealing, and Hillingdon, you’ll typically see price differences track a few measurable drivers: transport connectivity (especially rail and Tube access), the share of larger family homes versus flats, and the local supply pipeline.
In practice, you’ll often find Brent’s pricing pushed by stronger Zone 2–3 access and higher flat density, while Ealing can command a premium where Elizabeth line reach and retail intensity lift Local amenities.
Harrow tends to price between those poles, reflecting mixed stock and competitive Transportation links on the Met line.
Hillingdon can look better value on a £/sq ft basis where distance to central nodes increases, but larger plots and owner-occupier demand can offset that.
Compare sold-price medians and £/sq ft, not asking prices.
Harrow Prices by Area: Winners, Laggards, Best Value
You’ll see the widest variation in Harrow prices when you break sales data down by neighbourhood, because recent growth rates and current £/sq ft don’t move in lockstep across the borough.
You can identify the top-performing areas by ranking YOY and 5-year price changes alongside liquidity metrics such as transaction volumes and time-to-sell.
You can then spot best value by flagging areas with below-borough median prices but improving fundamentals, including transport access, school catchments, and new development pipeline.
Top-Performing Harrow Neighborhoods
Where in Harrow do prices hold up best—and where do they lag? You’ll typically see the strongest pricing in Pinner, North Harrow, and parts of Harrow on the Hill, where larger period stock, strong school catchments, and fast links to the Metropolitan line support demand.
Historical development matters: conservation areas and consistent street patterns limit supply churn, which can stabilise values. Local amenities also help; walkable centres, parks, and low vacancy retail correlate with tighter discounting.
You’ll often find weaker performance in pockets of Wealdstone and Roxeth where smaller units dominate, density is higher, and buyer competition softens during rate shocks.
Across the borough, new-build micro-markets can diverge: premium blocks hold value when transport and services outperform competing schemes.
Undervalued Areas To Watch
Although headline averages often mask street-level variation, several Harrow micro-markets still price at a discount to their transport access, amenity base, and medium-term uplift potential. You’ll typically find better value on edges of established hubs—pockets near West Harrow, Wealdstone, and parts of South Harrow—where price-per-square-foot can lag comparable stock closer to prime village cores.
You should benchmark asking prices against recent sold data, adjusting for plot size, lease length, and condition.
You can improve risk-adjusted returns by screening for Local school quality gradients (catchment-side streets often trade tighter) and planned transportation improvements that reduce journey times.
You’ll want to prioritise low-volatility streets with stable rental demand, then model uplift using conservative reversion-to-mean assumptions, not best-case comps.
Fastest-Rising Harrow Neighbourhoods (and Why)
Why are some Harrow neighbourhoods outpacing others on price growth? You typically see the fastest gains where demand concentrates around reliable transport, scarce family stock, and measurable investment in new supply.
In South Harrow and Rayners Lane, proximity to the Piccadilly/Metropolitan lines and dense rental demand push bid prices up, especially for well-specified flats and luxury apartments that meet modern EPC expectations.
In Harrow-on-the-Hill, constrained conservation areas limit turnover, so marginal demand moves prices more.
In Wealdstone, regeneration-led retail and public-realm upgrades improve footfall and investor yields, tightening the market.
You also benefit where renovation costs deter speculative buying, reducing overbidding and supporting steadier, quality-led appreciation across recent comparables.
Where Harrow Prices Are Softening (Risk Factors)
You’re likely to see softer pricing in parts of Harrow where higher mortgage rates have tightened affordability and reduced buyer demand.
You can also expect more downward pressure in zones with concentrated new-build completions, where increased listings and incentives raise effective supply.
You should assess rate sensitivity (buyer profile, loan sizes) and pipeline stock (planning/handovers) to identify where pricing risk is highest.
High-Rate Mortgage Pressure
Where are higher mortgage rates biting hardest in Harrow? You’ll usually see the biggest sensitivity in mid-market family homes where buyers rely on large, high-LTV loans.
As rates rise, affordability stress shows up first in longer time-on-market, sharper renegotiations after surveys, and more failed chains. You can test this by tracking asking-to-achieved price gaps and fall-through rates across wards.
Historical development matters: areas dominated by post-war semis and 1980s estates often carry more rate-exposed buyer profiles than prime period stock.
In Market comparison with neighbouring boroughs, Harrow’s price-to-income and commute-value metrics can look stretched, so demand cools faster when monthly payments reset.
If you’re selling, you’ll need tighter pricing and stronger mortgage-ready buyers.
Oversupply In New Builds
Higher mortgage rates don’t just squeeze budgets; they also expose pockets of supply risk, and in Harrow that shows up most clearly in some new-build micro-markets. If you’re tracking price resilience, watch areas where multiple schemes complete within the same quarter and listings rise faster than agreed sales.
You’ll typically see incentives (stamp duty contributions, upgrades) before headline price cuts, but both signal weaker pricing power.
You can also expect softer appraisals when comparable evidence clusters around near-identical units, limiting valuation upside.
Where urban renewal has delivered high-density blocks, absorption can lag if investor demand cools or rental yields compress.
In contrast, streets with scarce stock and historic architecture often hold firmer, because substitution is lower and negotiation leverage shifts back to sellers.
Harrow Flat Prices: Studios, 1-Beds, 2-Beds
Although overall Harrow prices track wider London trends, flat values tend to split more sharply by unit size, lease length, and proximity to Underground stations. You’ll typically see studios priced with the highest £/sq ft, but they’re more rate-sensitive as mortgage affordability tightens and investor demand fades.
For 1-beds, you can often secure better liquidity, especially where service charges stay controlled and EPC ratings are C or above.
With 2-beds, you’ll usually pay a premium for a second bathroom, parking, or lift access, yet discounts widen on short leases and cladding-affected blocks.
You should benchmark against achieved prices, not asking, and adjust for station walk time, floor level, and build age.
Harrow cultural events and local park developments can support demand near town-centre amenities.
Harrow Family Homes: 3–4 Beds and Gardens
In many Harrow neighbourhoods, 3–4 bed family houses with gardens price less on internal finishes than on plot size, catchment demand, and how quickly you can reach the Underground.
You’ll typically see tighter price bands where homes share similar land depth and frontage, even if kitchens and bathrooms vary.
You can benchmark value by comparing sold prices per square foot against garden length, off-street parking, and distance to stations such as Harrow-on-the-Hill.
Local school rankings often correlate with lower time-on-market and smaller negotiated discounts, so you’ll need to factor catchment boundaries into your search.
Harrow historic architecture (Edwardian and interwar stock) can add a premium when original layouts support modern family use without sacrificing room sizes.
New-Build Premiums in Harrow: Where They Hold Up
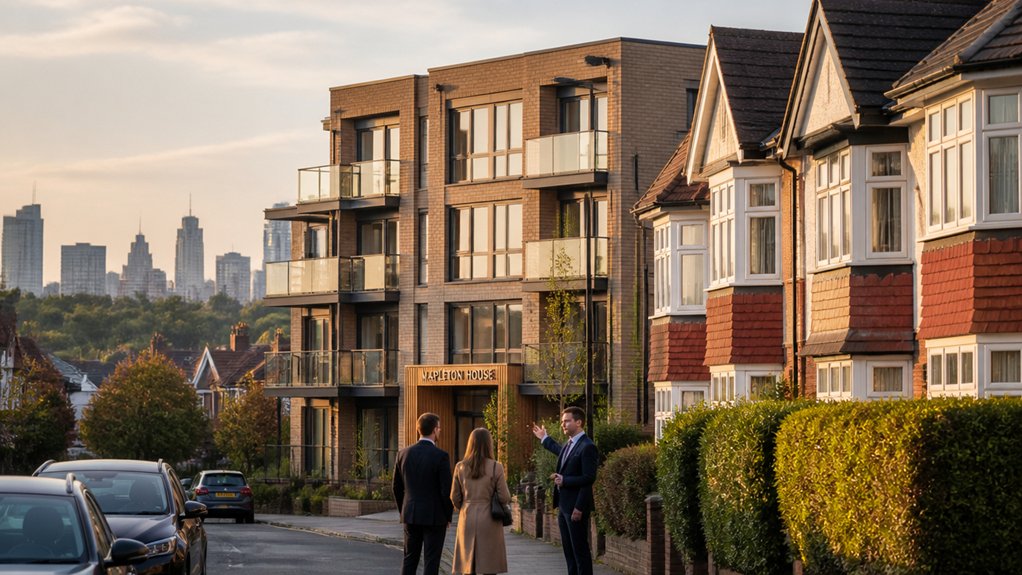
Family-house pricing in Harrow often tracks land, schools, and station access more than finishes, but new-builds add a separate layer of pricing driven by specification, warranties, and energy performance.
You’ll typically see the strongest premiums near fast links (Harrow-on-the-Hill, West Harrow) and in low-supply pockets where comparable stock is dated.
Premiums hold up best when you can evidence lower running costs (EPC B/A), predictable maintenance, and secure parking or lifts in denser schemes.
They soften where service charges materially raise ownership costs, or where multiple phases release similar units and dilute scarcity.
Historical market shifts show new-build uplifts compress after completion as “brand-new” becomes “nearly-new,” so your underwriting should model that decay.
For investment opportunities, focus on rental demand drivers and total cost of ownership.
Selling in Harrow: Tactics to Get the Best Price
When you sell in Harrow, you’ll usually secure the best price by aligning your launch timing, asking price, and marketing evidence with the specific buyer pool for your street—school-led families, rail commuters, or downsizers—rather than relying on general borough averages.
Price to the nearest competing sold comparables within 0.25 miles and six months, then adjust for tenure, parking, garden depth, and EPC band.
Launch midweek with complete documentation and measured floorplans so listings rank well and reduce fall-through risk.
Use targeted imagery: period features and Harrow heritage for character stock, or commute metrics for rail-led demand.
Quantify walk times to local amenities, schools, and green space.
Set a review point at 10–14 days; if view-to-offer conversion stays below benchmarks, recalibrate quickly.
Buying in Harrow: What to Check Before You Offer
Although Harrow’s price bands look consistent at borough level, your risk sits in property-specific factors you can verify before offering: recent sold comparables on the same road (not just asking prices), lease length and ground rent if it’s a flat, planning constraints and title boundaries, EPC and heating system age, and any red flags in the survey such as damp, roof wear, or movement.
Validate value by adjusting comparables for floor area, condition, and parking, then stress-test against Historical trends in that micro-location.
Ask for service-charge accounts, major-works notices, and fire-safety documentation on blocks.
Check flood, subsidence, and noise maps, plus local authority search timings.
Use Market forecasts to set a walk-away price if rates or supply shift, and keep your offer conditional on survey and mortgage valuation.
Conclusion
You’re steering Harrow like a barometer in a changeable sky: prices move, but signals stay measurable. Track average and median sales, the achieved-to-asked spread, and days on market to see whether heat is building or fading. Watch mortgage rates as the tide that lifts or strains affordability. Family homes, garden space, and new-build premiums behave like stronger beams in stress tests. If you sell, price to evidence; if you buy, verify risks before you bid.