

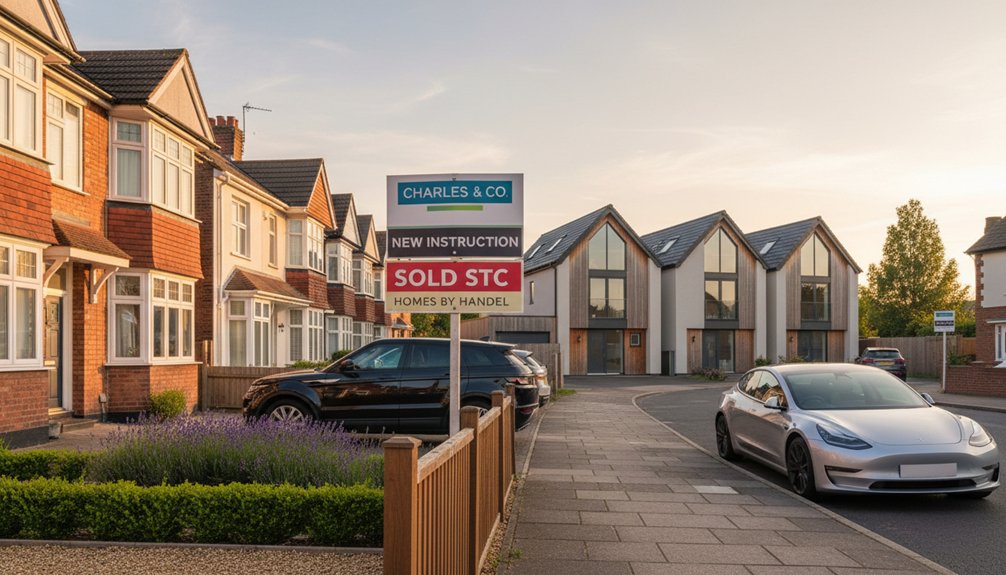
Camberley house prices are broadly flat to slightly down, so you’re seeing pricing power shift toward buyers. You’ll notice more listings need reductions to secure viewings, while correctly priced homes still attract steady interest, which signals underlying stability. With thin transaction volumes, quarter-to-quarter moves can look choppy, but the wider trend is sideways and driven by mortgage rates, local supply, and commuter demand. Keep going to see what that means for sellers and buyers in 2026.
Key Takeaways
- Camberley house prices are broadly flat or slightly down, with pricing power shifting toward buyers.
- Many sellers need price reductions, but correctly priced homes still attract viewings and sell, suggesting underlying stability.
- Price direction varies by property type: detached homes are more rate-sensitive, while semis and terraces tend to be steadier.
- Flats can lag, often reflecting affordability constraints, lease issues, or reduced investor demand.
- Near-term outlook is sideways, driven mainly by mortgage rates, thin transaction volumes, and local supply levels.
Are Camberley House Prices Rising or Falling?

How are Camberley house prices moving right now? You’re seeing a broadly flat-to-slightly-down trend, with pricing power shifting toward buyers. Listings that start high tend to need reductions, while correctly priced homes still attract viewings and proceed. That split points to market stability rather than a sharp correction.
You can track direction by watching asking-price changes, time on market, and the share of homes selling after reductions. If days-to-sell lengthens and reductions rise, momentum stays soft; if both tighten, prices firm.
Interest-rate expectations and local supply will steer near-term movement, so your best read comes from weekly stock levels and agreed-sale activity. On balance, future projections look modest: sideways pricing with pockets of resilience in best-in-class homes.
Latest Camberley Sold Prices: Averages and YoY Change
To gauge where Camberley house prices stand now, you’ll want to track the latest average sold price trend and how it’s moved over recent months.
You can then benchmark momentum using the year-on-year change to see whether prices are accelerating, flattening, or reversing.
Finally, you’ll get a clearer picture by comparing average sold prices by property type, since flats, terraced homes, semis, and detached houses often shift at different rates.
Average Sold Price Trends
Recently, Camberley’s sold prices have shown a clear shift in direction, with the latest averages highlighting both the current price level and the pace of change year on year. You can use the headline average sold price as your baseline, then track how it behaves across the most recent quarters to see whether momentum is firming or fading.
Look beyond a single month: when the rolling average lifts for several releases, you’re likely seeing broad-based demand rather than noise.
If the average stalls or slips while transaction volumes thin, that often signals market volatility and tighter buyer budgets.
Keep an eye on economic indicators like mortgage rates, wage growth, and inflation, because they typically move the average price before listings and completions fully adjust.
Year-On-Year Price Change
Where does Camberley’s market sit versus this time last year? You’ll see the clearest signal by comparing the latest 12-month average sold price with the prior 12 months. If that figure is higher, you’re looking at positive year-on-year growth; if it’s lower, the market’s easing; if it’s flat, you’ve got market stability.
You should also check whether the YoY change aligns with the most recent quarter, because widening gaps often flag acceleration, while narrowing gaps suggest a levelling trend.
Pair the headline YoY move with sales volumes: rising prices on falling transactions can indicate thin demand, while steady prices alongside steady volumes supports resilience.
For investment potential, focus on consistent YoY direction over one-off spikes and watch for revisions as more sales register.
Property Type Price Averages
Although the headline average gives you a quick read on Camberley, the clearest pricing signal comes from breaking sold prices down by property type—detached, semi-detached, terraced, and flats—then comparing each latest average to its year-on-year change, because the market rarely moves in sync across every segment.
Start by tracking detached sales: they’re the most sensitive to shifts in market demand and mortgage affordability, so a rising average with a weakening YoY rate can flag cooling at the top end.
Semi-detached and terraced averages often show steadier YoY movement, reflecting family-led demand and tighter supply.
Flats can diverge most; if their average drops while houses rise, you’re seeing affordability constraints and investor retreat.
Keep an eye on property taxation changes, which can amplify these gaps quickly.
Camberley House Prices by Area: Cheapest to Priciest
You’ll see Camberley’s price spread most clearly when you rank areas from lowest-cost neighbourhoods through mid-range hotspots to the highest-priced pockets.
You can benchmark each area against recent sold-price averages to spot where growth is accelerating versus cooling.
Next, you’ll compare what you pay at the bottom, middle, and top of the market to understand the local premium by location.
Lowest-Cost Neighborhoods
Looking for the lowest-cost pockets of Camberley? You’ll typically find them where terraces and smaller semis dominate and where recent sold prices cluster at the bottom of the local range. Track Land Registry averages and you’ll see these areas often show higher month-to-month volatility but clearer discounts versus the townwide mean.
If you’re prioritising Affordable neighborhoods, filter for lower price-per-square-foot streets near older retail parades and farther from the station premium.
For Investment potential, watch rental demand indicators: HMO licensing density, advertised yields, and time-to-let. In cheaper zones, modest refurbishments can move you closer to the median without paying prime-location pricing.
Still, check downside risk: longer resale times and sensitivity to rate changes can offset the headline bargain.
Mid-Range Price Hotspots
Mid-range hotspots sit between the bargain terraces and the station-premium streets, and they’re where Camberley’s “typical” sold prices tend to cluster. You’ll often see 1930s semis, modern estates, and family terraces trading here, with fewer extreme outliers skewing averages. That mix supports market stability, because demand comes from both first-time buyers stepping up and downsizers staying local.
When you track recent sold data, watch for tighter price bands, shorter negotiation gaps, and steadier quarter-on-quarter movements than in the cheapest pockets.
You can also gauge momentum by comparing asking-to-sold ratios and fall-through rates. If listings rise but sold prices hold, you’re in a balanced micro-market. Your best pricing strategies are evidence-led: anchor to nearest comparables, adjust for condition, and price within the most active search brackets.
Highest-Priced Areas
Where do Camberley’s top-end sold prices concentrate? You’ll typically see the priciest results clustering around the town’s greener fringes and premium commuter pockets, where plot sizes, privacy, and school access push values upward.
Recent sold-price patterns show the biggest premiums on detached homes with larger gardens, gated drives, and modern finishes, especially when supply stays tight.
You’re most likely to pay top money in streets dominated by Luxury estates and well-kept Historic homes, where scarcity drives competition and reduces discounting.
Track the gap between asking and achieved prices: in these areas it often narrows fastest when demand rises, signalling stronger pricing power.
If you’re budgeting at the top end, watch how quickly listings go under offer and how often properties relist, as both flag momentum shifts.
What’s Driving Camberley House Prices Right Now?
Although interest rates and buyer budgets still shape demand, Camberley house prices right now largely reflect a tug-of-war between tight local supply and steady commuter-led interest. You’re seeing fewer discretionary sellers, so well-presented homes attract quicker offers, while compromised stock lingers and anchors averages. That split supports market stability even when headline growth looks muted.
You can also track how economic factors feed sentiment: local employment resilience, upgrades around transport links, and ongoing demand for good schools keep enquiry levels firm. Downsizers and first-time movers concentrate on turnkey properties, which lifts the “best-in-class” price band.
Meanwhile, buyers negotiate harder on EPC ratings, lease terms, and properties needing renovation, widening the gap between asking and achieved prices.
How Do Mortgage Rates Affect Camberley Buying Power?
As mortgage rates shift, they directly reset what you can borrow in Camberley because lenders stress-test affordability and price monthly payments first.
With interest rate fluctuations, a 1 percentage-point rise typically lifts repayments by roughly 10–12% on a repayment loan, so the same income supports a smaller principal. That reduces your maximum offer or pushes you toward smaller homes or longer terms.
You’ll also see mortgage affordability tighten through lender caps on income multiples and higher assumed “reversion” rates in affordability models.
When rates fall, the reverse happens: your payment-to-income ratio improves, approvals rise, and demand can firm at key price bands.
Track swap rates and new product pricing weekly; they tend to lead local viewing volumes by several weeks.
What Do Camberley House Prices Mean for Sellers?
Mortgage-rate moves shape what buyers can afford, but Camberley house prices decide what you can realistically achieve as a seller and how quickly you’ll get there. Track the latest sold-price trend, not asking prices, to set expectations on achievable offers and time on market.
If prices are rising, you can price closer to recent comparables and still protect momentum, but you’ll need clean presentation to avoid buyer pushback.
If prices are flat or slipping, you’ll win by tightening your pricing to the newest evidence and pre-empting down-valuations.
Anchor your strategy on a defensible property valuation: condition, EPC, parking, and school catchments can shift outcomes.
Ignore market speculation and focus on measurable indicators—sale-through rates, reductions, and local supply—so you can choose between speed and maximum price.
What Do Camberley House Prices Mean for Buyers in 2026?
If Camberley house prices hold steady or edge up into 2026, you’ll need to base your budget on recent sold-price evidence—not optimistic asking prices—and stress-test what you can pay against likely valuation outcomes.
Track the gap between asking and achieved prices, time-to-sell, and fall-through rates; tighter spreads and faster sales signal market stability, while widening discounts imply negotiating room.
You should model repayments with realistic mortgage rates and a 1–2% valuation shortfall buffer, then prioritise properties with strong comparables on the same street.
If you’re stretching, buy for utility first and upside second: focus on layout, EPC, and transport access.
For investment potential, compare achievable rents to mortgage costs and factor voids, maintenance, and regulation risk too.
Conclusion
You’ve seen the averages, the YoY shifts, and how Camberley’s priciest pockets keep outrunning the value areas. Mortgage rates still set your ceiling, but sold-price momentum tells you where demand is actually landing. If you’re selling, you’ll price to the trend, not the headline. If you’re buying for 2026, you’ll watch affordability and stock tighten or loosen. The next few months decide it—quietly, in the completions data.